Microsoft ASP.NET Chart Control
4 mins read
The ASP.NET Chart control expands the data-visualization offerings in the .NET Framework. The ASP.NET Chart control was introduced as an add-on to the .NET Framework version 3.5 SP1 release. You don’t need to install charts for .NET Framework 4.0 because it is part of the framework.
Major features of the control:
- An unlimited number of chart areas, titles, legends, and annotations
- A wide variety of appearance settings for all chart elements.
- Advanced chart appearance, such as 3D, anti-aliasing, lighting, perspective, and more.
- Smart data labels that can automatically fit around data points.
- Statistical formulas and financial formulas.
- Simple binding and manipulation of chart data.
- Interactivity and AJAX.
- Support for common data formats, such as dates, times, and currency.
- Binary streaming.
In ASP.NET chart controls, we have the facilities of choosing the types and sub types, X and Y axis columns. Choosing the data members and data sources (like Entity model, XML, SQL server etc).
We can render the chart as a stream, image or image map. Also the image format/type is either jpeg, png, gif etc.
The ASP.NET Chart control for .NET Framework 3.5 SP1 download from here.
Samples Environment for Microsoft Chart Controls are as given here
Sample Code for MVC (Model View Controller)
The Microsoft Chart controls can be streamed from the Controller into an MVC View/HTML image tag. An interesting article on this is in FileResult (it is derived from ActionResult) http://www.thuban.org/CSharp. Using this class(FileResult) we can achieve the chart controls in the MVC framework.
View/HTML code:
ChartController: Controller Name
SampleChart1 & SampleChart2: Action Name in the Controller (ChartController).
The main advantage of this method is that it does not require the Server Page (Like ASPX page to have any ASP server controls).
Controller Class Code:
public class ChartController : Controller
{
///
/// Method is used to convert chart control to image file format
///
///
 ASP.Net chart control         ///
IS Convert to 3d image         ///
Width of the image         ///
Height of the image         ///
Name of the Image         /// FileResult
private FileResult ConvertToFile(Chart ChartControl, bool Is3D, Unit Width, Unit Height, string ImgName)
{
if (Is3D == true)
{
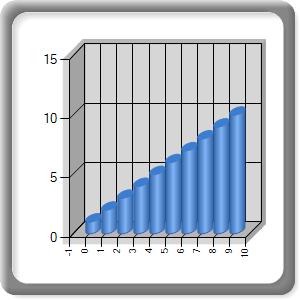
ChartControl.Series[0]["DrawingStyle"] = "Cylinder";
ChartControl.ChartAreas[0].Area3DStyle.Enable3D = true;
}
ChartControl.BorderSkin.PageColor = System.Drawing.Color.Transparent;
ChartControl.Width = Width;
ChartControl.Height = Height;
ChartControl.RenderType = System.Web.UI.DataVisualization.Charting.RenderType.ImageTag;
ChartControl.Palette = System.Web.UI.DataVisualization.Charting.ChartColorPalette.BrightPastel;
ChartControl.BorderSkin.SkinStyle = BorderSkinStyle.FrameThin1;
ChartControl.BorderlineWidth = 1;
ChartControl.BorderColor = System.Drawing.Color.Silver;
ChartControl.BorderlineDashStyle = ChartDashStyle.Solid;
ChartControl.BorderWidth = 1;
ChartControl.Legends.Add("Legend1").Enabled = false;
MemoryStream iMageStream = new MemoryStream();
ChartControl.SaveImage(iMageStream, ChartImageFormat.Png);
return new FileResult(ImgName + ".png", "imgage/png", iMageStream.ToArray());
}
///
/// 2d Sample chart
///
/// FileResult
public FileResult SampleChart1()
{
Chart Chart1 = new Chart();
Chart1.ChartAreas.Add("Series 2");
Chart1.Series.Add("Series 1").ChartType = SeriesChartType.Column;
for (int i = 0; i < 10; i++)
{
Chart1.Series["Series 1"].Points.AddXY(i, Convert.ToDouble(i + 1));
}
return ConvertToFile(Chart1, false, 300, 300, "Test");
}
///
/// 3D Sample chart
///
///
public FileResult SampleChart2()
{
Chart Chart1 = new Chart();
Chart1.ChartAreas.Add("Series 2");
Chart1.Series.Add("Series 1").ChartType = SeriesChartType.Column;
for (int i = 0; i < 10; i++)
{
Chart1.Series["Series 1"].Points.AddXY(i, Convert.ToDouble(i + 1));
}
return ConvertToFile(Chart2, false, 300, 300, "Test");
}

}
Latest Posts
Get the latest insights from Dot Com Infoway straight to your inbox.


![The Game Marketing Guide: Pre and Post-Launch Strategies [Infographic]](https://www.dotcominfoway.com/wp-content/uploads/2023/09/DCI-Game-Marketing-blog-1.jpg)


